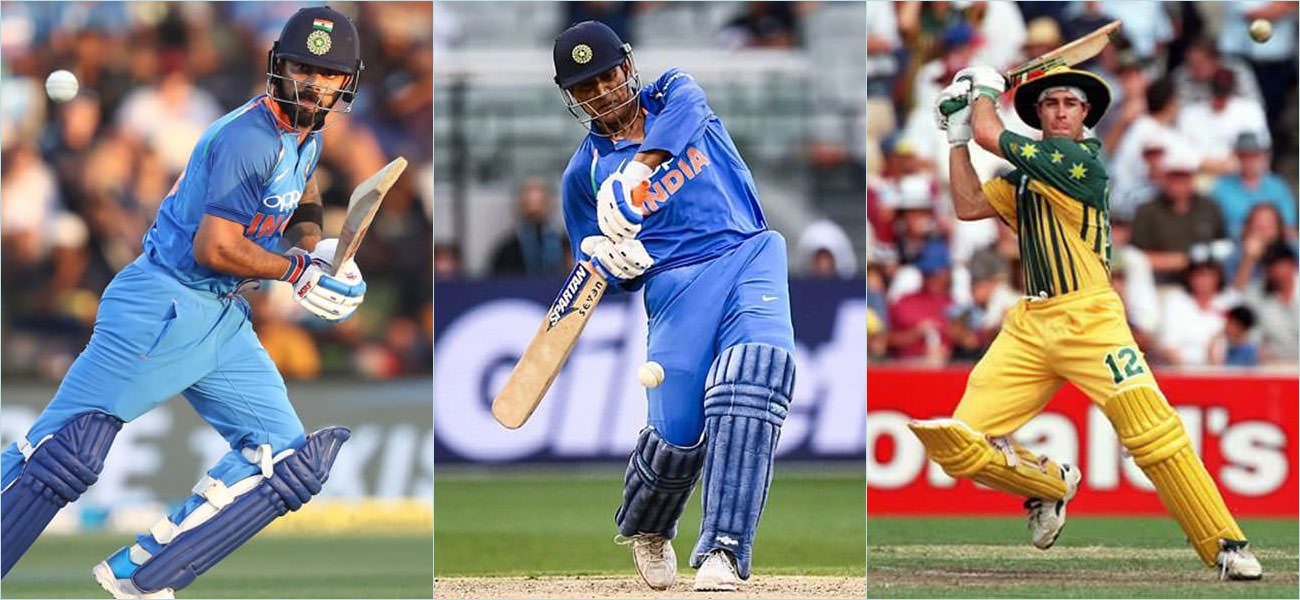
To find out the best ODI batsmen in run chases, we considered all the batsmen who had a chance of coming in the top 25 based on our criteria. We then judged the batsmen who qualified on the basis of five criteria to arrive at the final top 25 batsmen in run chases. It is to be noted that we have mentioned only the final 25 batsmen in all the criteria to make things uncomplicated.
The Trend Setter (TS) is the batsmen who does the best in a criteria. It is not necessary that he is ranked among the top 25. However, his rating is taking as the benchmark.
It is to be noted that all stats in the article are till 31/12/2020. We will update the Rankings periodically. So, without further ado, lets find out who are the best ODI batsmen in run chases.
WordPress database error: [Table 'ajhvyftjzm.Batsmen' doesn't exist]SELECT FP,LP,countryCode_id,full_name FROM Batsmen ORDER BY id ASC
PROLIFIC
This criteria gives points for number of runs scored in successful run chases. Runs scored by batsmen in ODI cricket have increased with time as more cricket has been played. To make things fair, we have divided the time from when ODI cricket began into three eras. All batsmen who have made their debut from 1971 to 1984 come under ERA 1. All batsmen who have made their debut from 1985 to 1999 come under ERA 2. All batsmen who have made their debut after 1999 come under ERA 3.
Now, pay attention as this is a complicated feature of the rating:-
- Sachin Tendulkar in ERA 2 has scored the most runs in successful run chases, i.e. 5490. So he will get the maximum 200.00 points in this criteria. All batsmen in his era are given points as a ratio to his runs.
- Desmond Haynes has scored the most runs in ERA 1, i.e. 3321 runs. If we compare him to Sachin, he will only get 120.98 (3321/5490X200) points.
- To allow batsmen of his era to compete in the rating, we took the percentage of the runs scored by Haynes compared to Sachin, i.e. 60.49%. We then arrived at the round figure of 40 (100% – 60%) and deducted it from the total points to arrive at a figure of 160.00 points for Haynes.
- All batsmen in the ERA of Haynes will get points as a ratio to his runs and not of Sachin’s runs.
- We have applied similar mathematics to all the Eras. I hope this has made things clear.
To be a TS in Prolific, the batsman should have scored the maximum runs in his era.
Notice: Undefined variable: LP in /home/353832.cloudwaysapps.com/ajhvyftjzm/public_html/wp-content/plugins/php-everywhere/public/partials/php-everywhere-block-public-display.php(31) : eval()’d code on line 1513
Notice: Undefined variable: rank in /home/353832.cloudwaysapps.com/ajhvyftjzm/public_html/wp-content/plugins/php-everywhere/public/partials/php-everywhere-block-public-display.php(31) : eval()’d code on line 1513
Notice: Undefined variable: era1Runs in /home/353832.cloudwaysapps.com/ajhvyftjzm/public_html/wp-content/plugins/php-everywhere/public/partials/php-everywhere-block-public-display.php(31) : eval()’d code on line 633
Warning: max(): When only one parameter is given, it must be an array in /home/353832.cloudwaysapps.com/ajhvyftjzm/public_html/wp-content/plugins/php-everywhere/public/partials/php-everywhere-block-public-display.php(31) : eval()’d code on line 633
Notice: Undefined variable: era2Runs in /home/353832.cloudwaysapps.com/ajhvyftjzm/public_html/wp-content/plugins/php-everywhere/public/partials/php-everywhere-block-public-display.php(31) : eval()’d code on line 634
Warning: max(): When only one parameter is given, it must be an array in /home/353832.cloudwaysapps.com/ajhvyftjzm/public_html/wp-content/plugins/php-everywhere/public/partials/php-everywhere-block-public-display.php(31) : eval()’d code on line 634
Notice: Undefined variable: era3Runs in /home/353832.cloudwaysapps.com/ajhvyftjzm/public_html/wp-content/plugins/php-everywhere/public/partials/php-everywhere-block-public-display.php(31) : eval()’d code on line 635
Warning: max(): When only one parameter is given, it must be an array in /home/353832.cloudwaysapps.com/ajhvyftjzm/public_html/wp-content/plugins/php-everywhere/public/partials/php-everywhere-block-public-display.php(31) : eval()’d code on line 635
Warning: Division by zero in /home/353832.cloudwaysapps.com/ajhvyftjzm/public_html/wp-content/plugins/php-everywhere/public/partials/php-everywhere-block-public-display.php(31) : eval()’d code on line 637
Warning: Division by zero in /home/353832.cloudwaysapps.com/ajhvyftjzm/public_html/wp-content/plugins/php-everywhere/public/partials/php-everywhere-block-public-display.php(31) : eval()’d code on line 638
Warning: Division by zero in /home/353832.cloudwaysapps.com/ajhvyftjzm/public_html/wp-content/plugins/php-everywhere/public/partials/php-everywhere-block-public-display.php(31) : eval()’d code on line 639
Notice: Undefined variable: era1Runs in /home/353832.cloudwaysapps.com/ajhvyftjzm/public_html/wp-content/plugins/php-everywhere/public/partials/php-everywhere-block-public-display.php(31) : eval()’d code on line 815
Warning: max(): When only one parameter is given, it must be an array in /home/353832.cloudwaysapps.com/ajhvyftjzm/public_html/wp-content/plugins/php-everywhere/public/partials/php-everywhere-block-public-display.php(31) : eval()’d code on line 815
Notice: Undefined variable: era1Runs in /home/353832.cloudwaysapps.com/ajhvyftjzm/public_html/wp-content/plugins/php-everywhere/public/partials/php-everywhere-block-public-display.php(31) : eval()’d code on line 815
Warning: array_search() expects parameter 2 to be array, null given in /home/353832.cloudwaysapps.com/ajhvyftjzm/public_html/wp-content/plugins/php-everywhere/public/partials/php-everywhere-block-public-display.php(31) : eval()’d code on line 815
Notice: Undefined variable: era2Runs in /home/353832.cloudwaysapps.com/ajhvyftjzm/public_html/wp-content/plugins/php-everywhere/public/partials/php-everywhere-block-public-display.php(31) : eval()’d code on line 816
Warning: max(): When only one parameter is given, it must be an array in /home/353832.cloudwaysapps.com/ajhvyftjzm/public_html/wp-content/plugins/php-everywhere/public/partials/php-everywhere-block-public-display.php(31) : eval()’d code on line 816
Notice: Undefined variable: era2Runs in /home/353832.cloudwaysapps.com/ajhvyftjzm/public_html/wp-content/plugins/php-everywhere/public/partials/php-everywhere-block-public-display.php(31) : eval()’d code on line 816
Warning: array_search() expects parameter 2 to be array, null given in /home/353832.cloudwaysapps.com/ajhvyftjzm/public_html/wp-content/plugins/php-everywhere/public/partials/php-everywhere-block-public-display.php(31) : eval()’d code on line 816
Notice: Undefined variable: era3Runs in /home/353832.cloudwaysapps.com/ajhvyftjzm/public_html/wp-content/plugins/php-everywhere/public/partials/php-everywhere-block-public-display.php(31) : eval()’d code on line 817
Warning: max(): When only one parameter is given, it must be an array in /home/353832.cloudwaysapps.com/ajhvyftjzm/public_html/wp-content/plugins/php-everywhere/public/partials/php-everywhere-block-public-display.php(31) : eval()’d code on line 817
Notice: Undefined variable: era3Runs in /home/353832.cloudwaysapps.com/ajhvyftjzm/public_html/wp-content/plugins/php-everywhere/public/partials/php-everywhere-block-public-display.php(31) : eval()’d code on line 817
Warning: array_search() expects parameter 2 to be array, null given in /home/353832.cloudwaysapps.com/ajhvyftjzm/public_html/wp-content/plugins/php-everywhere/public/partials/php-everywhere-block-public-display.php(31) : eval()’d code on line 817
Notice: Undefined variable: era1Runs in /home/353832.cloudwaysapps.com/ajhvyftjzm/public_html/wp-content/plugins/php-everywhere/public/partials/php-everywhere-block-public-display.php(31) : eval()’d code on line 818
Notice: Trying to access array offset on value of type null in /home/353832.cloudwaysapps.com/ajhvyftjzm/public_html/wp-content/plugins/php-everywhere/public/partials/php-everywhere-block-public-display.php(31) : eval()’d code on line 818
Notice: Undefined variable: era2Runs in /home/353832.cloudwaysapps.com/ajhvyftjzm/public_html/wp-content/plugins/php-everywhere/public/partials/php-everywhere-block-public-display.php(31) : eval()’d code on line 819
Notice: Trying to access array offset on value of type null in /home/353832.cloudwaysapps.com/ajhvyftjzm/public_html/wp-content/plugins/php-everywhere/public/partials/php-everywhere-block-public-display.php(31) : eval()’d code on line 819
Notice: Undefined variable: era3Runs in /home/353832.cloudwaysapps.com/ajhvyftjzm/public_html/wp-content/plugins/php-everywhere/public/partials/php-everywhere-block-public-display.php(31) : eval()’d code on line 820
Notice: Trying to access array offset on value of type null in /home/353832.cloudwaysapps.com/ajhvyftjzm/public_html/wp-content/plugins/php-everywhere/public/partials/php-everywhere-block-public-display.php(31) : eval()’d code on line 820
Warning: arsort() expects parameter 1 to be array, null given in /home/353832.cloudwaysapps.com/ajhvyftjzm/public_html/wp-content/plugins/php-everywhere/public/partials/php-everywhere-block-public-display.php(31) : eval()’d code on line 821
Warning: arsort() expects parameter 1 to be array, null given in /home/353832.cloudwaysapps.com/ajhvyftjzm/public_html/wp-content/plugins/php-everywhere/public/partials/php-everywhere-block-public-display.php(31) : eval()’d code on line 822
Warning: arsort() expects parameter 1 to be array, null given in /home/353832.cloudwaysapps.com/ajhvyftjzm/public_html/wp-content/plugins/php-everywhere/public/partials/php-everywhere-block-public-display.php(31) : eval()’d code on line 823
| RANK | ERA 1 | NAT | FP | LP | MAT | RUNS | C RUNS | RAT |
|---|---|---|---|---|---|---|---|---|
| TS | Notice: Undefined index: in /home/353832.cloudwaysapps.com/ajhvyftjzm/public_html/wp-content/plugins/php-everywhere/public/partials/php-everywhere-block-public-display.php(31) : eval()’d code on line 836 |
Notice: Undefined index: in /home/353832.cloudwaysapps.com/ajhvyftjzm/public_html/wp-content/plugins/php-everywhere/public/partials/php-everywhere-block-public-display.php(31) : eval()’d code on line 837 |
Notice: Undefined index: in /home/353832.cloudwaysapps.com/ajhvyftjzm/public_html/wp-content/plugins/php-everywhere/public/partials/php-everywhere-block-public-display.php(31) : eval()’d code on line 858 |
Notice: Trying to access array offset on value of type null in /home/353832.cloudwaysapps.com/ajhvyftjzm/public_html/wp-content/plugins/php-everywhere/public/partials/php-everywhere-block-public-display.php(31) : eval()’d code on line 859 |
Notice: Undefined variable: runs in /home/353832.cloudwaysapps.com/ajhvyftjzm/public_html/wp-content/plugins/php-everywhere/public/partials/php-everywhere-block-public-display.php(31) : eval()’d code on line 860 Notice: Trying to access array offset on value of type null in /home/353832.cloudwaysapps.com/ajhvyftjzm/public_html/wp-content/plugins/php-everywhere/public/partials/php-everywhere-block-public-display.php(31) : eval()’d code on line 860 Notice: Trying to access array offset on value of type null in /home/353832.cloudwaysapps.com/ajhvyftjzm/public_html/wp-content/plugins/php-everywhere/public/partials/php-everywhere-block-public-display.php(31) : eval()’d code on line 860 |
Notice: Undefined variable: runs in /home/353832.cloudwaysapps.com/ajhvyftjzm/public_html/wp-content/plugins/php-everywhere/public/partials/php-everywhere-block-public-display.php(31) : eval()’d code on line 861 Notice: Trying to access array offset on value of type null in /home/353832.cloudwaysapps.com/ajhvyftjzm/public_html/wp-content/plugins/php-everywhere/public/partials/php-everywhere-block-public-display.php(31) : eval()’d code on line 861 Notice: Trying to access array offset on value of type null in /home/353832.cloudwaysapps.com/ajhvyftjzm/public_html/wp-content/plugins/php-everywhere/public/partials/php-everywhere-block-public-display.php(31) : eval()’d code on line 861 |
Notice: Undefined index: in /home/353832.cloudwaysapps.com/ajhvyftjzm/public_html/wp-content/plugins/php-everywhere/public/partials/php-everywhere-block-public-display.php(31) : eval()’d code on line 863 0.00 |
| RANK | ERA 2 | NAT | FP | LP | MAT | RUNS | C RUNS | RAT |
|---|---|---|---|---|---|---|---|---|
| TS | Notice: Undefined index: in /home/353832.cloudwaysapps.com/ajhvyftjzm/public_html/wp-content/plugins/php-everywhere/public/partials/php-everywhere-block-public-display.php(31) : eval()’d code on line 914 |
Notice: Undefined index: in /home/353832.cloudwaysapps.com/ajhvyftjzm/public_html/wp-content/plugins/php-everywhere/public/partials/php-everywhere-block-public-display.php(31) : eval()’d code on line 915 |
Notice: Undefined index: in /home/353832.cloudwaysapps.com/ajhvyftjzm/public_html/wp-content/plugins/php-everywhere/public/partials/php-everywhere-block-public-display.php(31) : eval()’d code on line 936 |
Notice: Trying to access array offset on value of type null in /home/353832.cloudwaysapps.com/ajhvyftjzm/public_html/wp-content/plugins/php-everywhere/public/partials/php-everywhere-block-public-display.php(31) : eval()’d code on line 937 |
Notice: Undefined variable: runs in /home/353832.cloudwaysapps.com/ajhvyftjzm/public_html/wp-content/plugins/php-everywhere/public/partials/php-everywhere-block-public-display.php(31) : eval()’d code on line 938 Notice: Trying to access array offset on value of type null in /home/353832.cloudwaysapps.com/ajhvyftjzm/public_html/wp-content/plugins/php-everywhere/public/partials/php-everywhere-block-public-display.php(31) : eval()’d code on line 938 Notice: Trying to access array offset on value of type null in /home/353832.cloudwaysapps.com/ajhvyftjzm/public_html/wp-content/plugins/php-everywhere/public/partials/php-everywhere-block-public-display.php(31) : eval()’d code on line 938 |
Notice: Undefined variable: runs in /home/353832.cloudwaysapps.com/ajhvyftjzm/public_html/wp-content/plugins/php-everywhere/public/partials/php-everywhere-block-public-display.php(31) : eval()’d code on line 939 Notice: Trying to access array offset on value of type null in /home/353832.cloudwaysapps.com/ajhvyftjzm/public_html/wp-content/plugins/php-everywhere/public/partials/php-everywhere-block-public-display.php(31) : eval()’d code on line 939 Notice: Trying to access array offset on value of type null in /home/353832.cloudwaysapps.com/ajhvyftjzm/public_html/wp-content/plugins/php-everywhere/public/partials/php-everywhere-block-public-display.php(31) : eval()’d code on line 939 |
Notice: Undefined index: in /home/353832.cloudwaysapps.com/ajhvyftjzm/public_html/wp-content/plugins/php-everywhere/public/partials/php-everywhere-block-public-display.php(31) : eval()’d code on line 941 0.00 |
| RANK | ERA 3 | NAT | FP | LP | MAT | RUNS | C RUNS | RAT |
|---|---|---|---|---|---|---|---|---|
| TS | Notice: Undefined index: in /home/353832.cloudwaysapps.com/ajhvyftjzm/public_html/wp-content/plugins/php-everywhere/public/partials/php-everywhere-block-public-display.php(31) : eval()’d code on line 992 |
Notice: Undefined index: in /home/353832.cloudwaysapps.com/ajhvyftjzm/public_html/wp-content/plugins/php-everywhere/public/partials/php-everywhere-block-public-display.php(31) : eval()’d code on line 993 |
Notice: Undefined index: in /home/353832.cloudwaysapps.com/ajhvyftjzm/public_html/wp-content/plugins/php-everywhere/public/partials/php-everywhere-block-public-display.php(31) : eval()’d code on line 1014 |
Notice: Trying to access array offset on value of type null in /home/353832.cloudwaysapps.com/ajhvyftjzm/public_html/wp-content/plugins/php-everywhere/public/partials/php-everywhere-block-public-display.php(31) : eval()’d code on line 1015 |
Notice: Undefined variable: runs in /home/353832.cloudwaysapps.com/ajhvyftjzm/public_html/wp-content/plugins/php-everywhere/public/partials/php-everywhere-block-public-display.php(31) : eval()’d code on line 1016 Notice: Trying to access array offset on value of type null in /home/353832.cloudwaysapps.com/ajhvyftjzm/public_html/wp-content/plugins/php-everywhere/public/partials/php-everywhere-block-public-display.php(31) : eval()’d code on line 1016 Notice: Trying to access array offset on value of type null in /home/353832.cloudwaysapps.com/ajhvyftjzm/public_html/wp-content/plugins/php-everywhere/public/partials/php-everywhere-block-public-display.php(31) : eval()’d code on line 1016 |
Notice: Undefined variable: runs in /home/353832.cloudwaysapps.com/ajhvyftjzm/public_html/wp-content/plugins/php-everywhere/public/partials/php-everywhere-block-public-display.php(31) : eval()’d code on line 1017 Notice: Trying to access array offset on value of type null in /home/353832.cloudwaysapps.com/ajhvyftjzm/public_html/wp-content/plugins/php-everywhere/public/partials/php-everywhere-block-public-display.php(31) : eval()’d code on line 1017 Notice: Trying to access array offset on value of type null in /home/353832.cloudwaysapps.com/ajhvyftjzm/public_html/wp-content/plugins/php-everywhere/public/partials/php-everywhere-block-public-display.php(31) : eval()’d code on line 1017 |
Notice: Undefined index: in /home/353832.cloudwaysapps.com/ajhvyftjzm/public_html/wp-content/plugins/php-everywhere/public/partials/php-everywhere-block-public-display.php(31) : eval()’d code on line 1019 0.00 |
CONSISTENT
In this criteria, points are given for your average in successful run chases. Average of batsmen in ODI cricket has gone up with time. Moreover batsmen who play in the top order usually have a higher average. To negate these advantages, we found out the averages of all batsmen in the period a player was active and at a particular position in the batting order. Also, we found out their averages against different opposition so that a player doesn’t get advantage of playing against weak oppositions. All this data was combined to get the Comparative Average or the C AVE. This average is the average of players who played in the same era as the batsmen, at similar positions and against same oppositions.
We then found the Relative Average or R AVE. This average is: A batsman’s average divided by C AVE and then multiplied by 35. It may be considered as an average of a batsman if all batsmen played in the same era. A batsman can earn a maximum of 200.00 points for his R AVE. Everyone else is given points according to their ratio of the average of Trend Setter (TS), i.e. the batsman with the best R AVE. To remind you again, it is not necessary that TS is among the top 25 batsmen.
Note: To be a TS in Consistent, the batsman should have the best R Average while scoring a minimum of 1,500 runs.
Notice: Undefined variable: rank in /home/353832.cloudwaysapps.com/ajhvyftjzm/public_html/wp-content/plugins/php-everywhere/public/partials/php-everywhere-block-public-display.php(31) : eval()’d code on line 1528
Notice: Undefined variable: TS in /home/353832.cloudwaysapps.com/ajhvyftjzm/public_html/wp-content/plugins/php-everywhere/public/partials/php-everywhere-block-public-display.php(31) : eval()’d code on line 1083
Warning: max(): When only one parameter is given, it must be an array in /home/353832.cloudwaysapps.com/ajhvyftjzm/public_html/wp-content/plugins/php-everywhere/public/partials/php-everywhere-block-public-display.php(31) : eval()’d code on line 1083
Notice: Undefined variable: TS in /home/353832.cloudwaysapps.com/ajhvyftjzm/public_html/wp-content/plugins/php-everywhere/public/partials/php-everywhere-block-public-display.php(31) : eval()’d code on line 1083
Warning: array_search() expects parameter 2 to be array, null given in /home/353832.cloudwaysapps.com/ajhvyftjzm/public_html/wp-content/plugins/php-everywhere/public/partials/php-everywhere-block-public-display.php(31) : eval()’d code on line 1083
Notice: Undefined variable: rAve in /home/353832.cloudwaysapps.com/ajhvyftjzm/public_html/wp-content/plugins/php-everywhere/public/partials/php-everywhere-block-public-display.php(31) : eval()’d code on line 1084
Notice: Trying to access array offset on value of type null in /home/353832.cloudwaysapps.com/ajhvyftjzm/public_html/wp-content/plugins/php-everywhere/public/partials/php-everywhere-block-public-display.php(31) : eval()’d code on line 1084
Warning: arsort() expects parameter 1 to be array, null given in /home/353832.cloudwaysapps.com/ajhvyftjzm/public_html/wp-content/plugins/php-everywhere/public/partials/php-everywhere-block-public-display.php(31) : eval()’d code on line 1085
| RANK | BATSMAN | INNS | NO | RUNS | 100s | AVE | C AVE | R AVE | RAT |
|---|---|---|---|---|---|---|---|---|---|
| TS | Notice: Undefined index: in /home/353832.cloudwaysapps.com/ajhvyftjzm/public_html/wp-content/plugins/php-everywhere/public/partials/php-everywhere-block-public-display.php(31) : eval()’d code on line 1101 |
Notice: Undefined variable: ave in /home/353832.cloudwaysapps.com/ajhvyftjzm/public_html/wp-content/plugins/php-everywhere/public/partials/php-everywhere-block-public-display.php(31) : eval()’d code on line 1102 Notice: Trying to access array offset on value of type null in /home/353832.cloudwaysapps.com/ajhvyftjzm/public_html/wp-content/plugins/php-everywhere/public/partials/php-everywhere-block-public-display.php(31) : eval()’d code on line 1102 Notice: Trying to access array offset on value of type null in /home/353832.cloudwaysapps.com/ajhvyftjzm/public_html/wp-content/plugins/php-everywhere/public/partials/php-everywhere-block-public-display.php(31) : eval()’d code on line 1102 |
Notice: Undefined variable: ave in /home/353832.cloudwaysapps.com/ajhvyftjzm/public_html/wp-content/plugins/php-everywhere/public/partials/php-everywhere-block-public-display.php(31) : eval()’d code on line 1103 Notice: Trying to access array offset on value of type null in /home/353832.cloudwaysapps.com/ajhvyftjzm/public_html/wp-content/plugins/php-everywhere/public/partials/php-everywhere-block-public-display.php(31) : eval()’d code on line 1103 Notice: Trying to access array offset on value of type null in /home/353832.cloudwaysapps.com/ajhvyftjzm/public_html/wp-content/plugins/php-everywhere/public/partials/php-everywhere-block-public-display.php(31) : eval()’d code on line 1103 |
Notice: Undefined variable: ave in /home/353832.cloudwaysapps.com/ajhvyftjzm/public_html/wp-content/plugins/php-everywhere/public/partials/php-everywhere-block-public-display.php(31) : eval()’d code on line 1104 Notice: Trying to access array offset on value of type null in /home/353832.cloudwaysapps.com/ajhvyftjzm/public_html/wp-content/plugins/php-everywhere/public/partials/php-everywhere-block-public-display.php(31) : eval()’d code on line 1104 Notice: Trying to access array offset on value of type null in /home/353832.cloudwaysapps.com/ajhvyftjzm/public_html/wp-content/plugins/php-everywhere/public/partials/php-everywhere-block-public-display.php(31) : eval()’d code on line 1104 |
Notice: Undefined variable: ave in /home/353832.cloudwaysapps.com/ajhvyftjzm/public_html/wp-content/plugins/php-everywhere/public/partials/php-everywhere-block-public-display.php(31) : eval()’d code on line 1105 Notice: Trying to access array offset on value of type null in /home/353832.cloudwaysapps.com/ajhvyftjzm/public_html/wp-content/plugins/php-everywhere/public/partials/php-everywhere-block-public-display.php(31) : eval()’d code on line 1105 Notice: Trying to access array offset on value of type null in /home/353832.cloudwaysapps.com/ajhvyftjzm/public_html/wp-content/plugins/php-everywhere/public/partials/php-everywhere-block-public-display.php(31) : eval()’d code on line 1105 |
Notice: Undefined variable: ave in /home/353832.cloudwaysapps.com/ajhvyftjzm/public_html/wp-content/plugins/php-everywhere/public/partials/php-everywhere-block-public-display.php(31) : eval()’d code on line 1106 Notice: Trying to access array offset on value of type null in /home/353832.cloudwaysapps.com/ajhvyftjzm/public_html/wp-content/plugins/php-everywhere/public/partials/php-everywhere-block-public-display.php(31) : eval()’d code on line 1106 Notice: Trying to access array offset on value of type null in /home/353832.cloudwaysapps.com/ajhvyftjzm/public_html/wp-content/plugins/php-everywhere/public/partials/php-everywhere-block-public-display.php(31) : eval()’d code on line 1106 0.00 |
Notice: Undefined index: in /home/353832.cloudwaysapps.com/ajhvyftjzm/public_html/wp-content/plugins/php-everywhere/public/partials/php-everywhere-block-public-display.php(31) : eval()’d code on line 1107 0.00 |
Notice: Undefined variable: rAve in /home/353832.cloudwaysapps.com/ajhvyftjzm/public_html/wp-content/plugins/php-everywhere/public/partials/php-everywhere-block-public-display.php(31) : eval()’d code on line 1108 Notice: Trying to access array offset on value of type null in /home/353832.cloudwaysapps.com/ajhvyftjzm/public_html/wp-content/plugins/php-everywhere/public/partials/php-everywhere-block-public-display.php(31) : eval()’d code on line 1108 0.00 |
Notice: Undefined variable: rat in /home/353832.cloudwaysapps.com/ajhvyftjzm/public_html/wp-content/plugins/php-everywhere/public/partials/php-everywhere-block-public-display.php(31) : eval()’d code on line 1109 Notice: Trying to access array offset on value of type null in /home/353832.cloudwaysapps.com/ajhvyftjzm/public_html/wp-content/plugins/php-everywhere/public/partials/php-everywhere-block-public-display.php(31) : eval()’d code on line 1109 0.00 |
DOMINANT
This criteria gives points for Strike Rates (SR) in successful run chases. Like in Average, we have found the Comparative SRs of batsmen and then their Relative SRs. Points too are given in the same way. A maximum of 200.00 points can be earned for your R SR.
Note: To be a TS in Dominant, the batsman should have the best R Strike Rate while scoring a minimum of 1,500 runs at a R Ave of more than 40.
Notice: Undefined variable: rank in /home/353832.cloudwaysapps.com/ajhvyftjzm/public_html/wp-content/plugins/php-everywhere/public/partials/php-everywhere-block-public-display.php(31) : eval()’d code on line 1535
Notice: Undefined variable: TS in /home/353832.cloudwaysapps.com/ajhvyftjzm/public_html/wp-content/plugins/php-everywhere/public/partials/php-everywhere-block-public-display.php(31) : eval()’d code on line 1153
Warning: max(): When only one parameter is given, it must be an array in /home/353832.cloudwaysapps.com/ajhvyftjzm/public_html/wp-content/plugins/php-everywhere/public/partials/php-everywhere-block-public-display.php(31) : eval()’d code on line 1153
Notice: Undefined variable: TS in /home/353832.cloudwaysapps.com/ajhvyftjzm/public_html/wp-content/plugins/php-everywhere/public/partials/php-everywhere-block-public-display.php(31) : eval()’d code on line 1153
Warning: array_search() expects parameter 2 to be array, null given in /home/353832.cloudwaysapps.com/ajhvyftjzm/public_html/wp-content/plugins/php-everywhere/public/partials/php-everywhere-block-public-display.php(31) : eval()’d code on line 1153
Notice: Undefined variable: rSR in /home/353832.cloudwaysapps.com/ajhvyftjzm/public_html/wp-content/plugins/php-everywhere/public/partials/php-everywhere-block-public-display.php(31) : eval()’d code on line 1154
Notice: Trying to access array offset on value of type null in /home/353832.cloudwaysapps.com/ajhvyftjzm/public_html/wp-content/plugins/php-everywhere/public/partials/php-everywhere-block-public-display.php(31) : eval()’d code on line 1154
Warning: arsort() expects parameter 1 to be array, null given in /home/353832.cloudwaysapps.com/ajhvyftjzm/public_html/wp-content/plugins/php-everywhere/public/partials/php-everywhere-block-public-display.php(31) : eval()’d code on line 1155
| RANK | BATSMAN | RUNS | BF | SR | C SR | R SR | RAT |
|---|---|---|---|---|---|---|---|
| TS | Notice: Undefined index: in /home/353832.cloudwaysapps.com/ajhvyftjzm/public_html/wp-content/plugins/php-everywhere/public/partials/php-everywhere-block-public-display.php(31) : eval()’d code on line 1169 |
Notice: Undefined variable: SR in /home/353832.cloudwaysapps.com/ajhvyftjzm/public_html/wp-content/plugins/php-everywhere/public/partials/php-everywhere-block-public-display.php(31) : eval()’d code on line 1170 Notice: Trying to access array offset on value of type null in /home/353832.cloudwaysapps.com/ajhvyftjzm/public_html/wp-content/plugins/php-everywhere/public/partials/php-everywhere-block-public-display.php(31) : eval()’d code on line 1170 Notice: Trying to access array offset on value of type null in /home/353832.cloudwaysapps.com/ajhvyftjzm/public_html/wp-content/plugins/php-everywhere/public/partials/php-everywhere-block-public-display.php(31) : eval()’d code on line 1170 |
Notice: Undefined variable: SR in /home/353832.cloudwaysapps.com/ajhvyftjzm/public_html/wp-content/plugins/php-everywhere/public/partials/php-everywhere-block-public-display.php(31) : eval()’d code on line 1171 Notice: Trying to access array offset on value of type null in /home/353832.cloudwaysapps.com/ajhvyftjzm/public_html/wp-content/plugins/php-everywhere/public/partials/php-everywhere-block-public-display.php(31) : eval()’d code on line 1171 Notice: Trying to access array offset on value of type null in /home/353832.cloudwaysapps.com/ajhvyftjzm/public_html/wp-content/plugins/php-everywhere/public/partials/php-everywhere-block-public-display.php(31) : eval()’d code on line 1171 |
Notice: Undefined variable: SR in /home/353832.cloudwaysapps.com/ajhvyftjzm/public_html/wp-content/plugins/php-everywhere/public/partials/php-everywhere-block-public-display.php(31) : eval()’d code on line 1172 Notice: Trying to access array offset on value of type null in /home/353832.cloudwaysapps.com/ajhvyftjzm/public_html/wp-content/plugins/php-everywhere/public/partials/php-everywhere-block-public-display.php(31) : eval()’d code on line 1172 Notice: Trying to access array offset on value of type null in /home/353832.cloudwaysapps.com/ajhvyftjzm/public_html/wp-content/plugins/php-everywhere/public/partials/php-everywhere-block-public-display.php(31) : eval()’d code on line 1172 0.00 |
Notice: Undefined index: in /home/353832.cloudwaysapps.com/ajhvyftjzm/public_html/wp-content/plugins/php-everywhere/public/partials/php-everywhere-block-public-display.php(31) : eval()’d code on line 1173 0.00 |
Notice: Undefined variable: rSR in /home/353832.cloudwaysapps.com/ajhvyftjzm/public_html/wp-content/plugins/php-everywhere/public/partials/php-everywhere-block-public-display.php(31) : eval()’d code on line 1174 Notice: Trying to access array offset on value of type null in /home/353832.cloudwaysapps.com/ajhvyftjzm/public_html/wp-content/plugins/php-everywhere/public/partials/php-everywhere-block-public-display.php(31) : eval()’d code on line 1174 0.00 |
Notice: Undefined variable: rat in /home/353832.cloudwaysapps.com/ajhvyftjzm/public_html/wp-content/plugins/php-everywhere/public/partials/php-everywhere-block-public-display.php(31) : eval()’d code on line 1175 Notice: Trying to access array offset on value of type null in /home/353832.cloudwaysapps.com/ajhvyftjzm/public_html/wp-content/plugins/php-everywhere/public/partials/php-everywhere-block-public-display.php(31) : eval()’d code on line 1175 0.00 |
BIG INNINGS POTENTIAL
In this criteria; we found out the top 5 scores of a batsman in successful run chases. Ave Big Score (BS) is simply the top 5 scores divided by 5. As in the Prolific criteria, we have split the batsmen in ERAs and given points accordingly.
Note: To be a TS in BIP, the batsman should have the best Average High Score in his era.
Notice: Undefined variable: rank in /home/353832.cloudwaysapps.com/ajhvyftjzm/public_html/wp-content/plugins/php-everywhere/public/partials/php-everywhere-block-public-display.php(31) : eval()’d code on line 1541
WordPress database error: [Table 'ajhvyftjzm.Top_5_Scores' doesn't exist]SELECT ts_1,ts_2,ts_3,ts_4,ts_5 FROM Top_5_Scores WHERE Top_Score_Type=7
Notice: Undefined variable: era1BIP in /home/353832.cloudwaysapps.com/ajhvyftjzm/public_html/wp-content/plugins/php-everywhere/public/partials/php-everywhere-block-public-display.php(31) : eval()’d code on line 721
Warning: max(): When only one parameter is given, it must be an array in /home/353832.cloudwaysapps.com/ajhvyftjzm/public_html/wp-content/plugins/php-everywhere/public/partials/php-everywhere-block-public-display.php(31) : eval()’d code on line 721
Notice: Undefined variable: era2BIP in /home/353832.cloudwaysapps.com/ajhvyftjzm/public_html/wp-content/plugins/php-everywhere/public/partials/php-everywhere-block-public-display.php(31) : eval()’d code on line 722
Warning: max(): When only one parameter is given, it must be an array in /home/353832.cloudwaysapps.com/ajhvyftjzm/public_html/wp-content/plugins/php-everywhere/public/partials/php-everywhere-block-public-display.php(31) : eval()’d code on line 722
Notice: Undefined variable: era3BIP in /home/353832.cloudwaysapps.com/ajhvyftjzm/public_html/wp-content/plugins/php-everywhere/public/partials/php-everywhere-block-public-display.php(31) : eval()’d code on line 723
Warning: max(): When only one parameter is given, it must be an array in /home/353832.cloudwaysapps.com/ajhvyftjzm/public_html/wp-content/plugins/php-everywhere/public/partials/php-everywhere-block-public-display.php(31) : eval()’d code on line 723
Warning: Division by zero in /home/353832.cloudwaysapps.com/ajhvyftjzm/public_html/wp-content/plugins/php-everywhere/public/partials/php-everywhere-block-public-display.php(31) : eval()’d code on line 725
Warning: Division by zero in /home/353832.cloudwaysapps.com/ajhvyftjzm/public_html/wp-content/plugins/php-everywhere/public/partials/php-everywhere-block-public-display.php(31) : eval()’d code on line 726
Warning: Division by zero in /home/353832.cloudwaysapps.com/ajhvyftjzm/public_html/wp-content/plugins/php-everywhere/public/partials/php-everywhere-block-public-display.php(31) : eval()’d code on line 727
Notice: Undefined variable: era1BIP in /home/353832.cloudwaysapps.com/ajhvyftjzm/public_html/wp-content/plugins/php-everywhere/public/partials/php-everywhere-block-public-display.php(31) : eval()’d code on line 1219
Warning: max(): When only one parameter is given, it must be an array in /home/353832.cloudwaysapps.com/ajhvyftjzm/public_html/wp-content/plugins/php-everywhere/public/partials/php-everywhere-block-public-display.php(31) : eval()’d code on line 1219
Notice: Undefined variable: era1BIP in /home/353832.cloudwaysapps.com/ajhvyftjzm/public_html/wp-content/plugins/php-everywhere/public/partials/php-everywhere-block-public-display.php(31) : eval()’d code on line 1219
Warning: array_search() expects parameter 2 to be array, null given in /home/353832.cloudwaysapps.com/ajhvyftjzm/public_html/wp-content/plugins/php-everywhere/public/partials/php-everywhere-block-public-display.php(31) : eval()’d code on line 1219
Notice: Undefined variable: era2BIP in /home/353832.cloudwaysapps.com/ajhvyftjzm/public_html/wp-content/plugins/php-everywhere/public/partials/php-everywhere-block-public-display.php(31) : eval()’d code on line 1220
Warning: max(): When only one parameter is given, it must be an array in /home/353832.cloudwaysapps.com/ajhvyftjzm/public_html/wp-content/plugins/php-everywhere/public/partials/php-everywhere-block-public-display.php(31) : eval()’d code on line 1220
Notice: Undefined variable: era2BIP in /home/353832.cloudwaysapps.com/ajhvyftjzm/public_html/wp-content/plugins/php-everywhere/public/partials/php-everywhere-block-public-display.php(31) : eval()’d code on line 1220
Warning: array_search() expects parameter 2 to be array, null given in /home/353832.cloudwaysapps.com/ajhvyftjzm/public_html/wp-content/plugins/php-everywhere/public/partials/php-everywhere-block-public-display.php(31) : eval()’d code on line 1220
Notice: Undefined variable: era3BIP in /home/353832.cloudwaysapps.com/ajhvyftjzm/public_html/wp-content/plugins/php-everywhere/public/partials/php-everywhere-block-public-display.php(31) : eval()’d code on line 1221
Warning: max(): When only one parameter is given, it must be an array in /home/353832.cloudwaysapps.com/ajhvyftjzm/public_html/wp-content/plugins/php-everywhere/public/partials/php-everywhere-block-public-display.php(31) : eval()’d code on line 1221
Notice: Undefined variable: era3BIP in /home/353832.cloudwaysapps.com/ajhvyftjzm/public_html/wp-content/plugins/php-everywhere/public/partials/php-everywhere-block-public-display.php(31) : eval()’d code on line 1221
Warning: array_search() expects parameter 2 to be array, null given in /home/353832.cloudwaysapps.com/ajhvyftjzm/public_html/wp-content/plugins/php-everywhere/public/partials/php-everywhere-block-public-display.php(31) : eval()’d code on line 1221
Notice: Undefined variable: era1BIP in /home/353832.cloudwaysapps.com/ajhvyftjzm/public_html/wp-content/plugins/php-everywhere/public/partials/php-everywhere-block-public-display.php(31) : eval()’d code on line 1222
Notice: Trying to access array offset on value of type null in /home/353832.cloudwaysapps.com/ajhvyftjzm/public_html/wp-content/plugins/php-everywhere/public/partials/php-everywhere-block-public-display.php(31) : eval()’d code on line 1222
Notice: Undefined variable: era2BIP in /home/353832.cloudwaysapps.com/ajhvyftjzm/public_html/wp-content/plugins/php-everywhere/public/partials/php-everywhere-block-public-display.php(31) : eval()’d code on line 1223
Notice: Trying to access array offset on value of type null in /home/353832.cloudwaysapps.com/ajhvyftjzm/public_html/wp-content/plugins/php-everywhere/public/partials/php-everywhere-block-public-display.php(31) : eval()’d code on line 1223
Notice: Undefined variable: era3BIP in /home/353832.cloudwaysapps.com/ajhvyftjzm/public_html/wp-content/plugins/php-everywhere/public/partials/php-everywhere-block-public-display.php(31) : eval()’d code on line 1224
Notice: Trying to access array offset on value of type null in /home/353832.cloudwaysapps.com/ajhvyftjzm/public_html/wp-content/plugins/php-everywhere/public/partials/php-everywhere-block-public-display.php(31) : eval()’d code on line 1224
Warning: arsort() expects parameter 1 to be array, null given in /home/353832.cloudwaysapps.com/ajhvyftjzm/public_html/wp-content/plugins/php-everywhere/public/partials/php-everywhere-block-public-display.php(31) : eval()’d code on line 1225
Warning: arsort() expects parameter 1 to be array, null given in /home/353832.cloudwaysapps.com/ajhvyftjzm/public_html/wp-content/plugins/php-everywhere/public/partials/php-everywhere-block-public-display.php(31) : eval()’d code on line 1226
Warning: arsort() expects parameter 1 to be array, null given in /home/353832.cloudwaysapps.com/ajhvyftjzm/public_html/wp-content/plugins/php-everywhere/public/partials/php-everywhere-block-public-display.php(31) : eval()’d code on line 1227
| RANK | ERA 1 | TS 1 | TS 2 | TS 3 | TS 4 | TS 5 | AVE TS | C ATS | RAT |
|---|---|---|---|---|---|---|---|---|---|
| TS | Notice: Undefined index: in /home/353832.cloudwaysapps.com/ajhvyftjzm/public_html/wp-content/plugins/php-everywhere/public/partials/php-everywhere-block-public-display.php(31) : eval()’d code on line 1241 |
Notice: Undefined offset: -1 in /home/353832.cloudwaysapps.com/ajhvyftjzm/public_html/wp-content/plugins/php-everywhere/public/partials/php-everywhere-block-public-display.php(31) : eval()’d code on line 1242 Notice: Trying to get property ‘ts_1’ of non-object in /home/353832.cloudwaysapps.com/ajhvyftjzm/public_html/wp-content/plugins/php-everywhere/public/partials/php-everywhere-block-public-display.php(31) : eval()’d code on line 1242 |
Notice: Undefined offset: -1 in /home/353832.cloudwaysapps.com/ajhvyftjzm/public_html/wp-content/plugins/php-everywhere/public/partials/php-everywhere-block-public-display.php(31) : eval()’d code on line 1243 Notice: Trying to get property ‘ts_2’ of non-object in /home/353832.cloudwaysapps.com/ajhvyftjzm/public_html/wp-content/plugins/php-everywhere/public/partials/php-everywhere-block-public-display.php(31) : eval()’d code on line 1243 |
Notice: Undefined offset: -1 in /home/353832.cloudwaysapps.com/ajhvyftjzm/public_html/wp-content/plugins/php-everywhere/public/partials/php-everywhere-block-public-display.php(31) : eval()’d code on line 1244 Notice: Trying to get property ‘ts_3’ of non-object in /home/353832.cloudwaysapps.com/ajhvyftjzm/public_html/wp-content/plugins/php-everywhere/public/partials/php-everywhere-block-public-display.php(31) : eval()’d code on line 1244 |
Notice: Undefined offset: -1 in /home/353832.cloudwaysapps.com/ajhvyftjzm/public_html/wp-content/plugins/php-everywhere/public/partials/php-everywhere-block-public-display.php(31) : eval()’d code on line 1245 Notice: Trying to get property ‘ts_4’ of non-object in /home/353832.cloudwaysapps.com/ajhvyftjzm/public_html/wp-content/plugins/php-everywhere/public/partials/php-everywhere-block-public-display.php(31) : eval()’d code on line 1245 |
Notice: Undefined offset: -1 in /home/353832.cloudwaysapps.com/ajhvyftjzm/public_html/wp-content/plugins/php-everywhere/public/partials/php-everywhere-block-public-display.php(31) : eval()’d code on line 1246 Notice: Trying to get property ‘ts_5’ of non-object in /home/353832.cloudwaysapps.com/ajhvyftjzm/public_html/wp-content/plugins/php-everywhere/public/partials/php-everywhere-block-public-display.php(31) : eval()’d code on line 1246 |
Notice: Undefined offset: -1 in /home/353832.cloudwaysapps.com/ajhvyftjzm/public_html/wp-content/plugins/php-everywhere/public/partials/php-everywhere-block-public-display.php(31) : eval()’d code on line 1247 Notice: Trying to get property ‘ts_1’ of non-object in /home/353832.cloudwaysapps.com/ajhvyftjzm/public_html/wp-content/plugins/php-everywhere/public/partials/php-everywhere-block-public-display.php(31) : eval()’d code on line 1247 Notice: Undefined offset: -1 in /home/353832.cloudwaysapps.com/ajhvyftjzm/public_html/wp-content/plugins/php-everywhere/public/partials/php-everywhere-block-public-display.php(31) : eval()’d code on line 1247 Notice: Trying to get property ‘ts_2’ of non-object in /home/353832.cloudwaysapps.com/ajhvyftjzm/public_html/wp-content/plugins/php-everywhere/public/partials/php-everywhere-block-public-display.php(31) : eval()’d code on line 1247 Notice: Undefined offset: -1 in /home/353832.cloudwaysapps.com/ajhvyftjzm/public_html/wp-content/plugins/php-everywhere/public/partials/php-everywhere-block-public-display.php(31) : eval()’d code on line 1247 Notice: Trying to get property ‘ts_3’ of non-object in /home/353832.cloudwaysapps.com/ajhvyftjzm/public_html/wp-content/plugins/php-everywhere/public/partials/php-everywhere-block-public-display.php(31) : eval()’d code on line 1247 Notice: Undefined offset: -1 in /home/353832.cloudwaysapps.com/ajhvyftjzm/public_html/wp-content/plugins/php-everywhere/public/partials/php-everywhere-block-public-display.php(31) : eval()’d code on line 1247 Notice: Trying to get property ‘ts_4’ of non-object in /home/353832.cloudwaysapps.com/ajhvyftjzm/public_html/wp-content/plugins/php-everywhere/public/partials/php-everywhere-block-public-display.php(31) : eval()’d code on line 1247 Notice: Undefined offset: -1 in /home/353832.cloudwaysapps.com/ajhvyftjzm/public_html/wp-content/plugins/php-everywhere/public/partials/php-everywhere-block-public-display.php(31) : eval()’d code on line 1248 Notice: Trying to get property ‘ts_5’ of non-object in /home/353832.cloudwaysapps.com/ajhvyftjzm/public_html/wp-content/plugins/php-everywhere/public/partials/php-everywhere-block-public-display.php(31) : eval()’d code on line 1248 0.00 |
0.00 | Notice: Undefined index: in /home/353832.cloudwaysapps.com/ajhvyftjzm/public_html/wp-content/plugins/php-everywhere/public/partials/php-everywhere-block-public-display.php(31) : eval()’d code on line 1250 0.00 |
| RANK | ERA 2 | TS 1 | TS 2 | TS 3 | TS 4 | TS 5 | AVE TS | C ATS | RAT |
|---|---|---|---|---|---|---|---|---|---|
| TS | Notice: Undefined index: in /home/353832.cloudwaysapps.com/ajhvyftjzm/public_html/wp-content/plugins/php-everywhere/public/partials/php-everywhere-block-public-display.php(31) : eval()’d code on line 1284 |
Notice: Undefined offset: -1 in /home/353832.cloudwaysapps.com/ajhvyftjzm/public_html/wp-content/plugins/php-everywhere/public/partials/php-everywhere-block-public-display.php(31) : eval()’d code on line 1285 Notice: Trying to get property ‘ts_1’ of non-object in /home/353832.cloudwaysapps.com/ajhvyftjzm/public_html/wp-content/plugins/php-everywhere/public/partials/php-everywhere-block-public-display.php(31) : eval()’d code on line 1285 |
Notice: Undefined offset: -1 in /home/353832.cloudwaysapps.com/ajhvyftjzm/public_html/wp-content/plugins/php-everywhere/public/partials/php-everywhere-block-public-display.php(31) : eval()’d code on line 1286 Notice: Trying to get property ‘ts_2’ of non-object in /home/353832.cloudwaysapps.com/ajhvyftjzm/public_html/wp-content/plugins/php-everywhere/public/partials/php-everywhere-block-public-display.php(31) : eval()’d code on line 1286 |
Notice: Undefined offset: -1 in /home/353832.cloudwaysapps.com/ajhvyftjzm/public_html/wp-content/plugins/php-everywhere/public/partials/php-everywhere-block-public-display.php(31) : eval()’d code on line 1287 Notice: Trying to get property ‘ts_3’ of non-object in /home/353832.cloudwaysapps.com/ajhvyftjzm/public_html/wp-content/plugins/php-everywhere/public/partials/php-everywhere-block-public-display.php(31) : eval()’d code on line 1287 |
Notice: Undefined offset: -1 in /home/353832.cloudwaysapps.com/ajhvyftjzm/public_html/wp-content/plugins/php-everywhere/public/partials/php-everywhere-block-public-display.php(31) : eval()’d code on line 1288 Notice: Trying to get property ‘ts_4’ of non-object in /home/353832.cloudwaysapps.com/ajhvyftjzm/public_html/wp-content/plugins/php-everywhere/public/partials/php-everywhere-block-public-display.php(31) : eval()’d code on line 1288 |
Notice: Undefined offset: -1 in /home/353832.cloudwaysapps.com/ajhvyftjzm/public_html/wp-content/plugins/php-everywhere/public/partials/php-everywhere-block-public-display.php(31) : eval()’d code on line 1289 Notice: Trying to get property ‘ts_5’ of non-object in /home/353832.cloudwaysapps.com/ajhvyftjzm/public_html/wp-content/plugins/php-everywhere/public/partials/php-everywhere-block-public-display.php(31) : eval()’d code on line 1289 |
Notice: Undefined offset: -1 in /home/353832.cloudwaysapps.com/ajhvyftjzm/public_html/wp-content/plugins/php-everywhere/public/partials/php-everywhere-block-public-display.php(31) : eval()’d code on line 1290 Notice: Trying to get property ‘ts_1’ of non-object in /home/353832.cloudwaysapps.com/ajhvyftjzm/public_html/wp-content/plugins/php-everywhere/public/partials/php-everywhere-block-public-display.php(31) : eval()’d code on line 1290 Notice: Undefined offset: -1 in /home/353832.cloudwaysapps.com/ajhvyftjzm/public_html/wp-content/plugins/php-everywhere/public/partials/php-everywhere-block-public-display.php(31) : eval()’d code on line 1290 Notice: Trying to get property ‘ts_2’ of non-object in /home/353832.cloudwaysapps.com/ajhvyftjzm/public_html/wp-content/plugins/php-everywhere/public/partials/php-everywhere-block-public-display.php(31) : eval()’d code on line 1290 Notice: Undefined offset: -1 in /home/353832.cloudwaysapps.com/ajhvyftjzm/public_html/wp-content/plugins/php-everywhere/public/partials/php-everywhere-block-public-display.php(31) : eval()’d code on line 1290 Notice: Trying to get property ‘ts_3’ of non-object in /home/353832.cloudwaysapps.com/ajhvyftjzm/public_html/wp-content/plugins/php-everywhere/public/partials/php-everywhere-block-public-display.php(31) : eval()’d code on line 1290 Notice: Undefined offset: -1 in /home/353832.cloudwaysapps.com/ajhvyftjzm/public_html/wp-content/plugins/php-everywhere/public/partials/php-everywhere-block-public-display.php(31) : eval()’d code on line 1290 Notice: Trying to get property ‘ts_4’ of non-object in /home/353832.cloudwaysapps.com/ajhvyftjzm/public_html/wp-content/plugins/php-everywhere/public/partials/php-everywhere-block-public-display.php(31) : eval()’d code on line 1290 Notice: Undefined offset: -1 in /home/353832.cloudwaysapps.com/ajhvyftjzm/public_html/wp-content/plugins/php-everywhere/public/partials/php-everywhere-block-public-display.php(31) : eval()’d code on line 1291 Notice: Trying to get property ‘ts_5’ of non-object in /home/353832.cloudwaysapps.com/ajhvyftjzm/public_html/wp-content/plugins/php-everywhere/public/partials/php-everywhere-block-public-display.php(31) : eval()’d code on line 1291 0.00 |
0.00 | Notice: Undefined index: in /home/353832.cloudwaysapps.com/ajhvyftjzm/public_html/wp-content/plugins/php-everywhere/public/partials/php-everywhere-block-public-display.php(31) : eval()’d code on line 1293 0.00 |
| RANK | ERA 3 | TS 1 | TS 2 | TS 3 | TS 4 | TS 5 | AVE TS | C ATS | RAT |
|---|---|---|---|---|---|---|---|---|---|
| TS | Notice: Undefined index: in /home/353832.cloudwaysapps.com/ajhvyftjzm/public_html/wp-content/plugins/php-everywhere/public/partials/php-everywhere-block-public-display.php(31) : eval()’d code on line 1327 |
Notice: Undefined offset: -1 in /home/353832.cloudwaysapps.com/ajhvyftjzm/public_html/wp-content/plugins/php-everywhere/public/partials/php-everywhere-block-public-display.php(31) : eval()’d code on line 1328 Notice: Trying to get property ‘ts_1’ of non-object in /home/353832.cloudwaysapps.com/ajhvyftjzm/public_html/wp-content/plugins/php-everywhere/public/partials/php-everywhere-block-public-display.php(31) : eval()’d code on line 1328 |
Notice: Undefined offset: -1 in /home/353832.cloudwaysapps.com/ajhvyftjzm/public_html/wp-content/plugins/php-everywhere/public/partials/php-everywhere-block-public-display.php(31) : eval()’d code on line 1329 Notice: Trying to get property ‘ts_2’ of non-object in /home/353832.cloudwaysapps.com/ajhvyftjzm/public_html/wp-content/plugins/php-everywhere/public/partials/php-everywhere-block-public-display.php(31) : eval()’d code on line 1329 |
Notice: Undefined offset: -1 in /home/353832.cloudwaysapps.com/ajhvyftjzm/public_html/wp-content/plugins/php-everywhere/public/partials/php-everywhere-block-public-display.php(31) : eval()’d code on line 1330 Notice: Trying to get property ‘ts_3’ of non-object in /home/353832.cloudwaysapps.com/ajhvyftjzm/public_html/wp-content/plugins/php-everywhere/public/partials/php-everywhere-block-public-display.php(31) : eval()’d code on line 1330 |
Notice: Undefined offset: -1 in /home/353832.cloudwaysapps.com/ajhvyftjzm/public_html/wp-content/plugins/php-everywhere/public/partials/php-everywhere-block-public-display.php(31) : eval()’d code on line 1331 Notice: Trying to get property ‘ts_4’ of non-object in /home/353832.cloudwaysapps.com/ajhvyftjzm/public_html/wp-content/plugins/php-everywhere/public/partials/php-everywhere-block-public-display.php(31) : eval()’d code on line 1331 |
Notice: Undefined offset: -1 in /home/353832.cloudwaysapps.com/ajhvyftjzm/public_html/wp-content/plugins/php-everywhere/public/partials/php-everywhere-block-public-display.php(31) : eval()’d code on line 1332 Notice: Trying to get property ‘ts_5’ of non-object in /home/353832.cloudwaysapps.com/ajhvyftjzm/public_html/wp-content/plugins/php-everywhere/public/partials/php-everywhere-block-public-display.php(31) : eval()’d code on line 1332 |
Notice: Undefined offset: -1 in /home/353832.cloudwaysapps.com/ajhvyftjzm/public_html/wp-content/plugins/php-everywhere/public/partials/php-everywhere-block-public-display.php(31) : eval()’d code on line 1333 Notice: Trying to get property ‘ts_1’ of non-object in /home/353832.cloudwaysapps.com/ajhvyftjzm/public_html/wp-content/plugins/php-everywhere/public/partials/php-everywhere-block-public-display.php(31) : eval()’d code on line 1333 Notice: Undefined offset: -1 in /home/353832.cloudwaysapps.com/ajhvyftjzm/public_html/wp-content/plugins/php-everywhere/public/partials/php-everywhere-block-public-display.php(31) : eval()’d code on line 1333 Notice: Trying to get property ‘ts_2’ of non-object in /home/353832.cloudwaysapps.com/ajhvyftjzm/public_html/wp-content/plugins/php-everywhere/public/partials/php-everywhere-block-public-display.php(31) : eval()’d code on line 1333 Notice: Undefined offset: -1 in /home/353832.cloudwaysapps.com/ajhvyftjzm/public_html/wp-content/plugins/php-everywhere/public/partials/php-everywhere-block-public-display.php(31) : eval()’d code on line 1333 Notice: Trying to get property ‘ts_3’ of non-object in /home/353832.cloudwaysapps.com/ajhvyftjzm/public_html/wp-content/plugins/php-everywhere/public/partials/php-everywhere-block-public-display.php(31) : eval()’d code on line 1333 Notice: Undefined offset: -1 in /home/353832.cloudwaysapps.com/ajhvyftjzm/public_html/wp-content/plugins/php-everywhere/public/partials/php-everywhere-block-public-display.php(31) : eval()’d code on line 1333 Notice: Trying to get property ‘ts_4’ of non-object in /home/353832.cloudwaysapps.com/ajhvyftjzm/public_html/wp-content/plugins/php-everywhere/public/partials/php-everywhere-block-public-display.php(31) : eval()’d code on line 1333 Notice: Undefined offset: -1 in /home/353832.cloudwaysapps.com/ajhvyftjzm/public_html/wp-content/plugins/php-everywhere/public/partials/php-everywhere-block-public-display.php(31) : eval()’d code on line 1334 Notice: Trying to get property ‘ts_5’ of non-object in /home/353832.cloudwaysapps.com/ajhvyftjzm/public_html/wp-content/plugins/php-everywhere/public/partials/php-everywhere-block-public-display.php(31) : eval()’d code on line 1334 0.00 |
0.00 | Notice: Undefined index: in /home/353832.cloudwaysapps.com/ajhvyftjzm/public_html/wp-content/plugins/php-everywhere/public/partials/php-everywhere-block-public-display.php(31) : eval()’d code on line 1336 0.00 |
FINISHING THE CHASE
In this criteria, we found out the number of times a batsman had the chance of finishing the chase, that is the number of 2nd innings. We then found out the number of times he was Not Out in successful chases. Points are then given for the percentage of times he was successful in being at the crease in a successful chase. The maximum points in this criteria is 200.00.
Note: To be a TS in this criteria, the batsman should have the best Not Out percentage while playing a minimum of 50 second innings.
Notice: Undefined variable: rank in /home/353832.cloudwaysapps.com/ajhvyftjzm/public_html/wp-content/plugins/php-everywhere/public/partials/php-everywhere-block-public-display.php(31) : eval()’d code on line 1548
Notice: Undefined variable: TS in /home/353832.cloudwaysapps.com/ajhvyftjzm/public_html/wp-content/plugins/php-everywhere/public/partials/php-everywhere-block-public-display.php(31) : eval()’d code on line 1378
Warning: max(): When only one parameter is given, it must be an array in /home/353832.cloudwaysapps.com/ajhvyftjzm/public_html/wp-content/plugins/php-everywhere/public/partials/php-everywhere-block-public-display.php(31) : eval()’d code on line 1378
Notice: Undefined variable: TS in /home/353832.cloudwaysapps.com/ajhvyftjzm/public_html/wp-content/plugins/php-everywhere/public/partials/php-everywhere-block-public-display.php(31) : eval()’d code on line 1378
Warning: array_search() expects parameter 2 to be array, null given in /home/353832.cloudwaysapps.com/ajhvyftjzm/public_html/wp-content/plugins/php-everywhere/public/partials/php-everywhere-block-public-display.php(31) : eval()’d code on line 1378
Notice: Undefined variable: rat in /home/353832.cloudwaysapps.com/ajhvyftjzm/public_html/wp-content/plugins/php-everywhere/public/partials/php-everywhere-block-public-display.php(31) : eval()’d code on line 1379
Notice: Trying to access array offset on value of type null in /home/353832.cloudwaysapps.com/ajhvyftjzm/public_html/wp-content/plugins/php-everywhere/public/partials/php-everywhere-block-public-display.php(31) : eval()’d code on line 1379
Warning: arsort() expects parameter 1 to be array, null given in /home/353832.cloudwaysapps.com/ajhvyftjzm/public_html/wp-content/plugins/php-everywhere/public/partials/php-everywhere-block-public-display.php(31) : eval()’d code on line 1380
| RANK | BATSMAN | 2ND INNS | NO | %AGE | RAT |
|---|---|---|---|---|---|
| TS | Notice: Undefined index: in /home/353832.cloudwaysapps.com/ajhvyftjzm/public_html/wp-content/plugins/php-everywhere/public/partials/php-everywhere-block-public-display.php(31) : eval()’d code on line 1392 |
Notice: Undefined index: in /home/353832.cloudwaysapps.com/ajhvyftjzm/public_html/wp-content/plugins/php-everywhere/public/partials/php-everywhere-block-public-display.php(31) : eval()’d code on line 1393 Notice: Trying to access array offset on value of type null in /home/353832.cloudwaysapps.com/ajhvyftjzm/public_html/wp-content/plugins/php-everywhere/public/partials/php-everywhere-block-public-display.php(31) : eval()’d code on line 1393 |
Notice: Undefined index: in /home/353832.cloudwaysapps.com/ajhvyftjzm/public_html/wp-content/plugins/php-everywhere/public/partials/php-everywhere-block-public-display.php(31) : eval()’d code on line 1394 Notice: Trying to access array offset on value of type null in /home/353832.cloudwaysapps.com/ajhvyftjzm/public_html/wp-content/plugins/php-everywhere/public/partials/php-everywhere-block-public-display.php(31) : eval()’d code on line 1394 |
Notice: Undefined variable: perc in /home/353832.cloudwaysapps.com/ajhvyftjzm/public_html/wp-content/plugins/php-everywhere/public/partials/php-everywhere-block-public-display.php(31) : eval()’d code on line 1395 Notice: Trying to access array offset on value of type null in /home/353832.cloudwaysapps.com/ajhvyftjzm/public_html/wp-content/plugins/php-everywhere/public/partials/php-everywhere-block-public-display.php(31) : eval()’d code on line 1395 0.00 |
Notice: Undefined variable: rat in /home/353832.cloudwaysapps.com/ajhvyftjzm/public_html/wp-content/plugins/php-everywhere/public/partials/php-everywhere-block-public-display.php(31) : eval()’d code on line 1396 Notice: Trying to access array offset on value of type null in /home/353832.cloudwaysapps.com/ajhvyftjzm/public_html/wp-content/plugins/php-everywhere/public/partials/php-everywhere-block-public-display.php(31) : eval()’d code on line 1396 0.00 |
FINAL SUCCESSFUL CHASES RATING
The total of the above five criteria comes out to be 1000.00 points. The Successful Chases (SC) Rating is the addition of the points a batsman scored in the five criteria. So, here are the top 25 Chase Masters in ODI cricket.
Notice: Undefined variable: rank in /home/353832.cloudwaysapps.com/ajhvyftjzm/public_html/wp-content/plugins/php-everywhere/public/partials/php-everywhere-block-public-display.php(31) : eval()’d code on line 1553
Notice: Undefined variable: era1Runs in /home/353832.cloudwaysapps.com/ajhvyftjzm/public_html/wp-content/plugins/php-everywhere/public/partials/php-everywhere-block-public-display.php(31) : eval()’d code on line 633
Warning: max(): When only one parameter is given, it must be an array in /home/353832.cloudwaysapps.com/ajhvyftjzm/public_html/wp-content/plugins/php-everywhere/public/partials/php-everywhere-block-public-display.php(31) : eval()’d code on line 633
Notice: Undefined variable: era2Runs in /home/353832.cloudwaysapps.com/ajhvyftjzm/public_html/wp-content/plugins/php-everywhere/public/partials/php-everywhere-block-public-display.php(31) : eval()’d code on line 634
Warning: max(): When only one parameter is given, it must be an array in /home/353832.cloudwaysapps.com/ajhvyftjzm/public_html/wp-content/plugins/php-everywhere/public/partials/php-everywhere-block-public-display.php(31) : eval()’d code on line 634
Notice: Undefined variable: era3Runs in /home/353832.cloudwaysapps.com/ajhvyftjzm/public_html/wp-content/plugins/php-everywhere/public/partials/php-everywhere-block-public-display.php(31) : eval()’d code on line 635
Warning: max(): When only one parameter is given, it must be an array in /home/353832.cloudwaysapps.com/ajhvyftjzm/public_html/wp-content/plugins/php-everywhere/public/partials/php-everywhere-block-public-display.php(31) : eval()’d code on line 635
Warning: Division by zero in /home/353832.cloudwaysapps.com/ajhvyftjzm/public_html/wp-content/plugins/php-everywhere/public/partials/php-everywhere-block-public-display.php(31) : eval()’d code on line 637
Warning: Division by zero in /home/353832.cloudwaysapps.com/ajhvyftjzm/public_html/wp-content/plugins/php-everywhere/public/partials/php-everywhere-block-public-display.php(31) : eval()’d code on line 638
Warning: Division by zero in /home/353832.cloudwaysapps.com/ajhvyftjzm/public_html/wp-content/plugins/php-everywhere/public/partials/php-everywhere-block-public-display.php(31) : eval()’d code on line 639
Notice: Undefined variable: era1BIP in /home/353832.cloudwaysapps.com/ajhvyftjzm/public_html/wp-content/plugins/php-everywhere/public/partials/php-everywhere-block-public-display.php(31) : eval()’d code on line 721
Warning: max(): When only one parameter is given, it must be an array in /home/353832.cloudwaysapps.com/ajhvyftjzm/public_html/wp-content/plugins/php-everywhere/public/partials/php-everywhere-block-public-display.php(31) : eval()’d code on line 721
Notice: Undefined variable: era2BIP in /home/353832.cloudwaysapps.com/ajhvyftjzm/public_html/wp-content/plugins/php-everywhere/public/partials/php-everywhere-block-public-display.php(31) : eval()’d code on line 722
Warning: max(): When only one parameter is given, it must be an array in /home/353832.cloudwaysapps.com/ajhvyftjzm/public_html/wp-content/plugins/php-everywhere/public/partials/php-everywhere-block-public-display.php(31) : eval()’d code on line 722
Notice: Undefined variable: era3BIP in /home/353832.cloudwaysapps.com/ajhvyftjzm/public_html/wp-content/plugins/php-everywhere/public/partials/php-everywhere-block-public-display.php(31) : eval()’d code on line 723
Warning: max(): When only one parameter is given, it must be an array in /home/353832.cloudwaysapps.com/ajhvyftjzm/public_html/wp-content/plugins/php-everywhere/public/partials/php-everywhere-block-public-display.php(31) : eval()’d code on line 723
Warning: Division by zero in /home/353832.cloudwaysapps.com/ajhvyftjzm/public_html/wp-content/plugins/php-everywhere/public/partials/php-everywhere-block-public-display.php(31) : eval()’d code on line 725
Warning: Division by zero in /home/353832.cloudwaysapps.com/ajhvyftjzm/public_html/wp-content/plugins/php-everywhere/public/partials/php-everywhere-block-public-display.php(31) : eval()’d code on line 726
Warning: Division by zero in /home/353832.cloudwaysapps.com/ajhvyftjzm/public_html/wp-content/plugins/php-everywhere/public/partials/php-everywhere-block-public-display.php(31) : eval()’d code on line 727
Warning: arsort() expects parameter 1 to be array, null given in /home/353832.cloudwaysapps.com/ajhvyftjzm/public_html/wp-content/plugins/php-everywhere/public/partials/php-everywhere-block-public-display.php(31) : eval()’d code on line 1424
| RANK | BATSMAN | NAT | PRO | CONS | ATT | BIP | FTC | SC RAT |
|---|